The PAX App: Explore Pods

In early 2021, I led the end-to-end design of Explore Pods, a guided, data-driven strain discovery feature in the PAX mobile and web apps. Over two phased releases, we achieved a 42% adoption rate—4,200 of our ~10,000 monthly active users—in the first six weeks, boosted average session duration to 6 minutes, increased pre-purchase intent by 13%, while lifting our Android app rating from 3.9★ to 4.2★.
Role
Design Lead
Tools
Sketch, Color Contrast Analyzer
Platform
The PAX App on Android and Web
Client
PAX
Year
2021
Team
2 Designers, 1 Researcher, 3 Engineers
Overview
Explore Pods simplifies cannabis strain discovery by surfacing lab-verified data, personalized guidance, and smart filters in a clean, education-first UI. This strategic feature aimed to own the pre-purchase moment, drive pod sales, and reinforce PAX’s authority beyond hardware.
The Problem
Users described strain discovery as “confusing, inconsistent, and high-risk.” From a mixed-methods study (N = 1,718), we identified five core pain points:
High cost of trial-and-error.
“I hate spending $40 on a pod that doesn’t feel right,” one user lamented.Overwhelming choice.
Unreliable strain information.
“Terms like indica/sativa leave me guessing,” said a frequent buyer.Low confidence in dispensary staff.
“I feel judged asking questions,” reported a novice user.Lack of transparency or education.
This friction led 62% of users to abandon purchases, eroding trust and conversion.
🔍 Discovery & Research
We combined:
A 10-minute Qualtrics survey (N = 1,718 cannabis users)
Qualitative interviews with both new and seasoned users
A competitive audit of Leafly, Weedmaps, Reddit, YouTube, and dispensary UX
📌 Key insights:
62% of users had abandoned a purchase due to uncertainty
Terms like indica and sativa were viewed as outdated
Users preferred familiar words: “relaxed,” “creative,” “sleep”
Trust increased significantly when lab-verified data was surfaced
Process Overview
The project followed a cross-functional, agile process across several phases:
Discovery & Research
Quantitative survey (1,700+ cannabis users)
Qualitative interviews
Competitive audit (Leafly, Weedmaps, Reddit, YouTube)
Regulatory landscape analysis
Definition & Prioritization
Identified core decision factors: effects, strain type, potency, flavor
Prioritized key flows: quiz-based onboarding, search/filter, strain detail
Collaborated with Data Science to model how effects would be aggregated
Design & Iteration
Responsive components for mobile, web, and Android
Visual explorations for data density, affordances, and accessibility
3+ full UI revisions based on user feedback and usability testing
Launch & Measurement
MVP → Full launch with phased rollout
Behavioral and survey-based success tracking
Design Execution
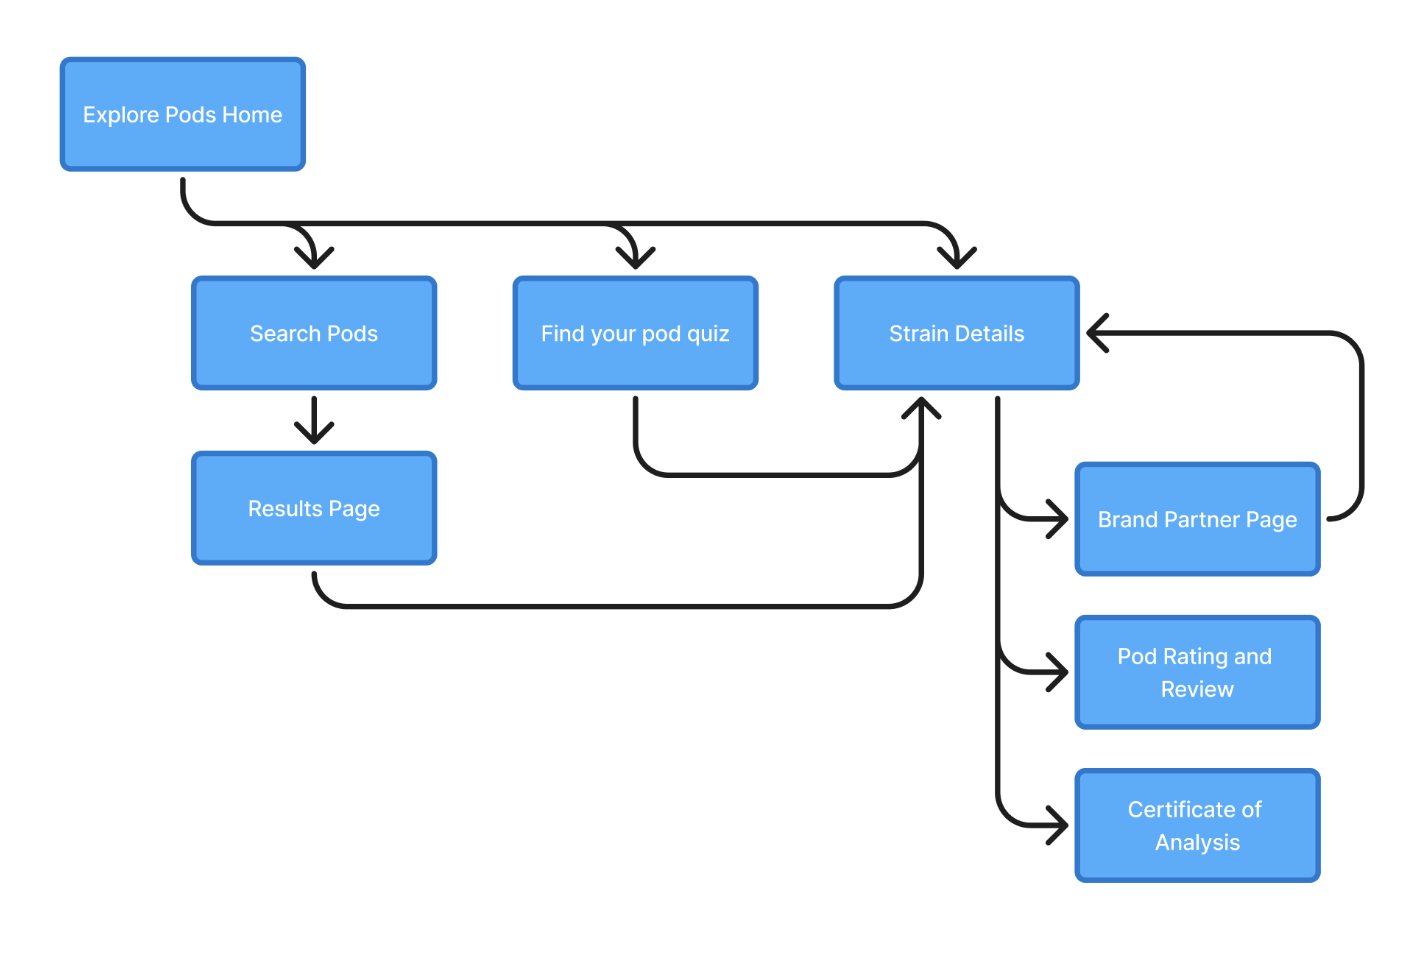
✦ Architecture & Information Design
The core flows supported three primary user intents:
“I want to browse or filter strains”
“I want a recommendation”
“I want to understand a strain I’ve already heard about”
We prioritized scannability, emotional tone, and consistency across entry points.
🛠️ Design Strategy
We intentionally designed Explore Pods as a modular, multi-surface experience, built to serve a range of user intents across native mobile, web, and desktop platforms.
Core UX Components:
Strain Detail Pages (lab data, effect tags, reviews)
Personalization Quiz for guided onboarding
Smart Filters and Search for power users
Similar Pods suggestions and favoriting
Retail Locator tied to user location
All flows were responsive, WCAG AA-compliant, and designed for reuse across product surfaces.
Flow 1: Device-Aware Discovery

🧭 Final Experience Flows

💡 Why it worked:
Anchored discovery in a known, real-time context
Used metadata (flavor/effect) to guide lateral exploration
Made re-purchase or upgrade intuitive and low-friction
✏️ UX Craft in Detail
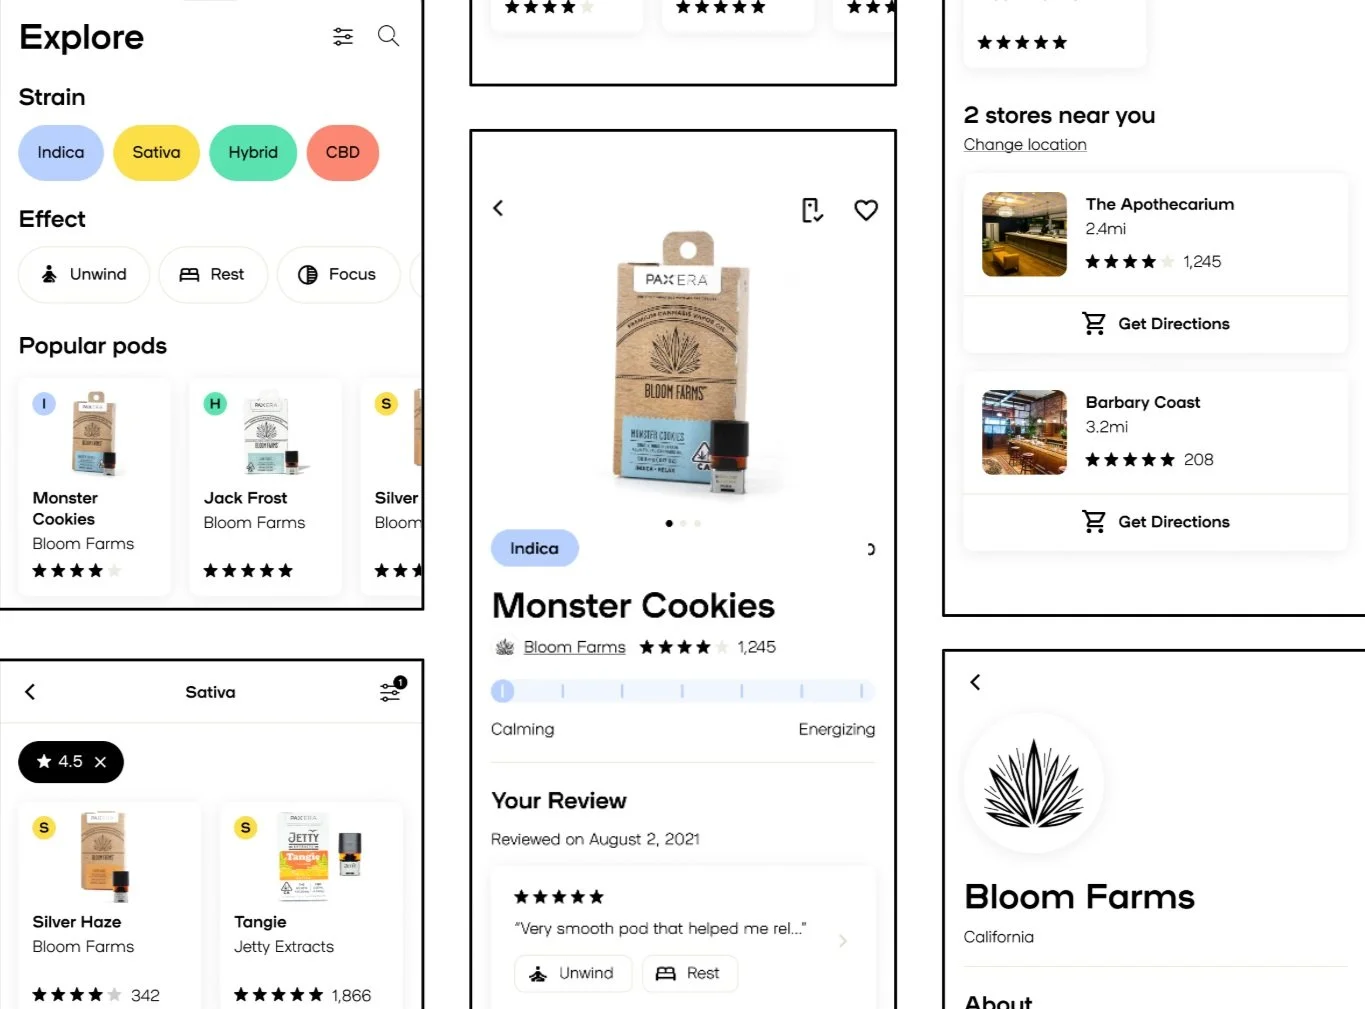
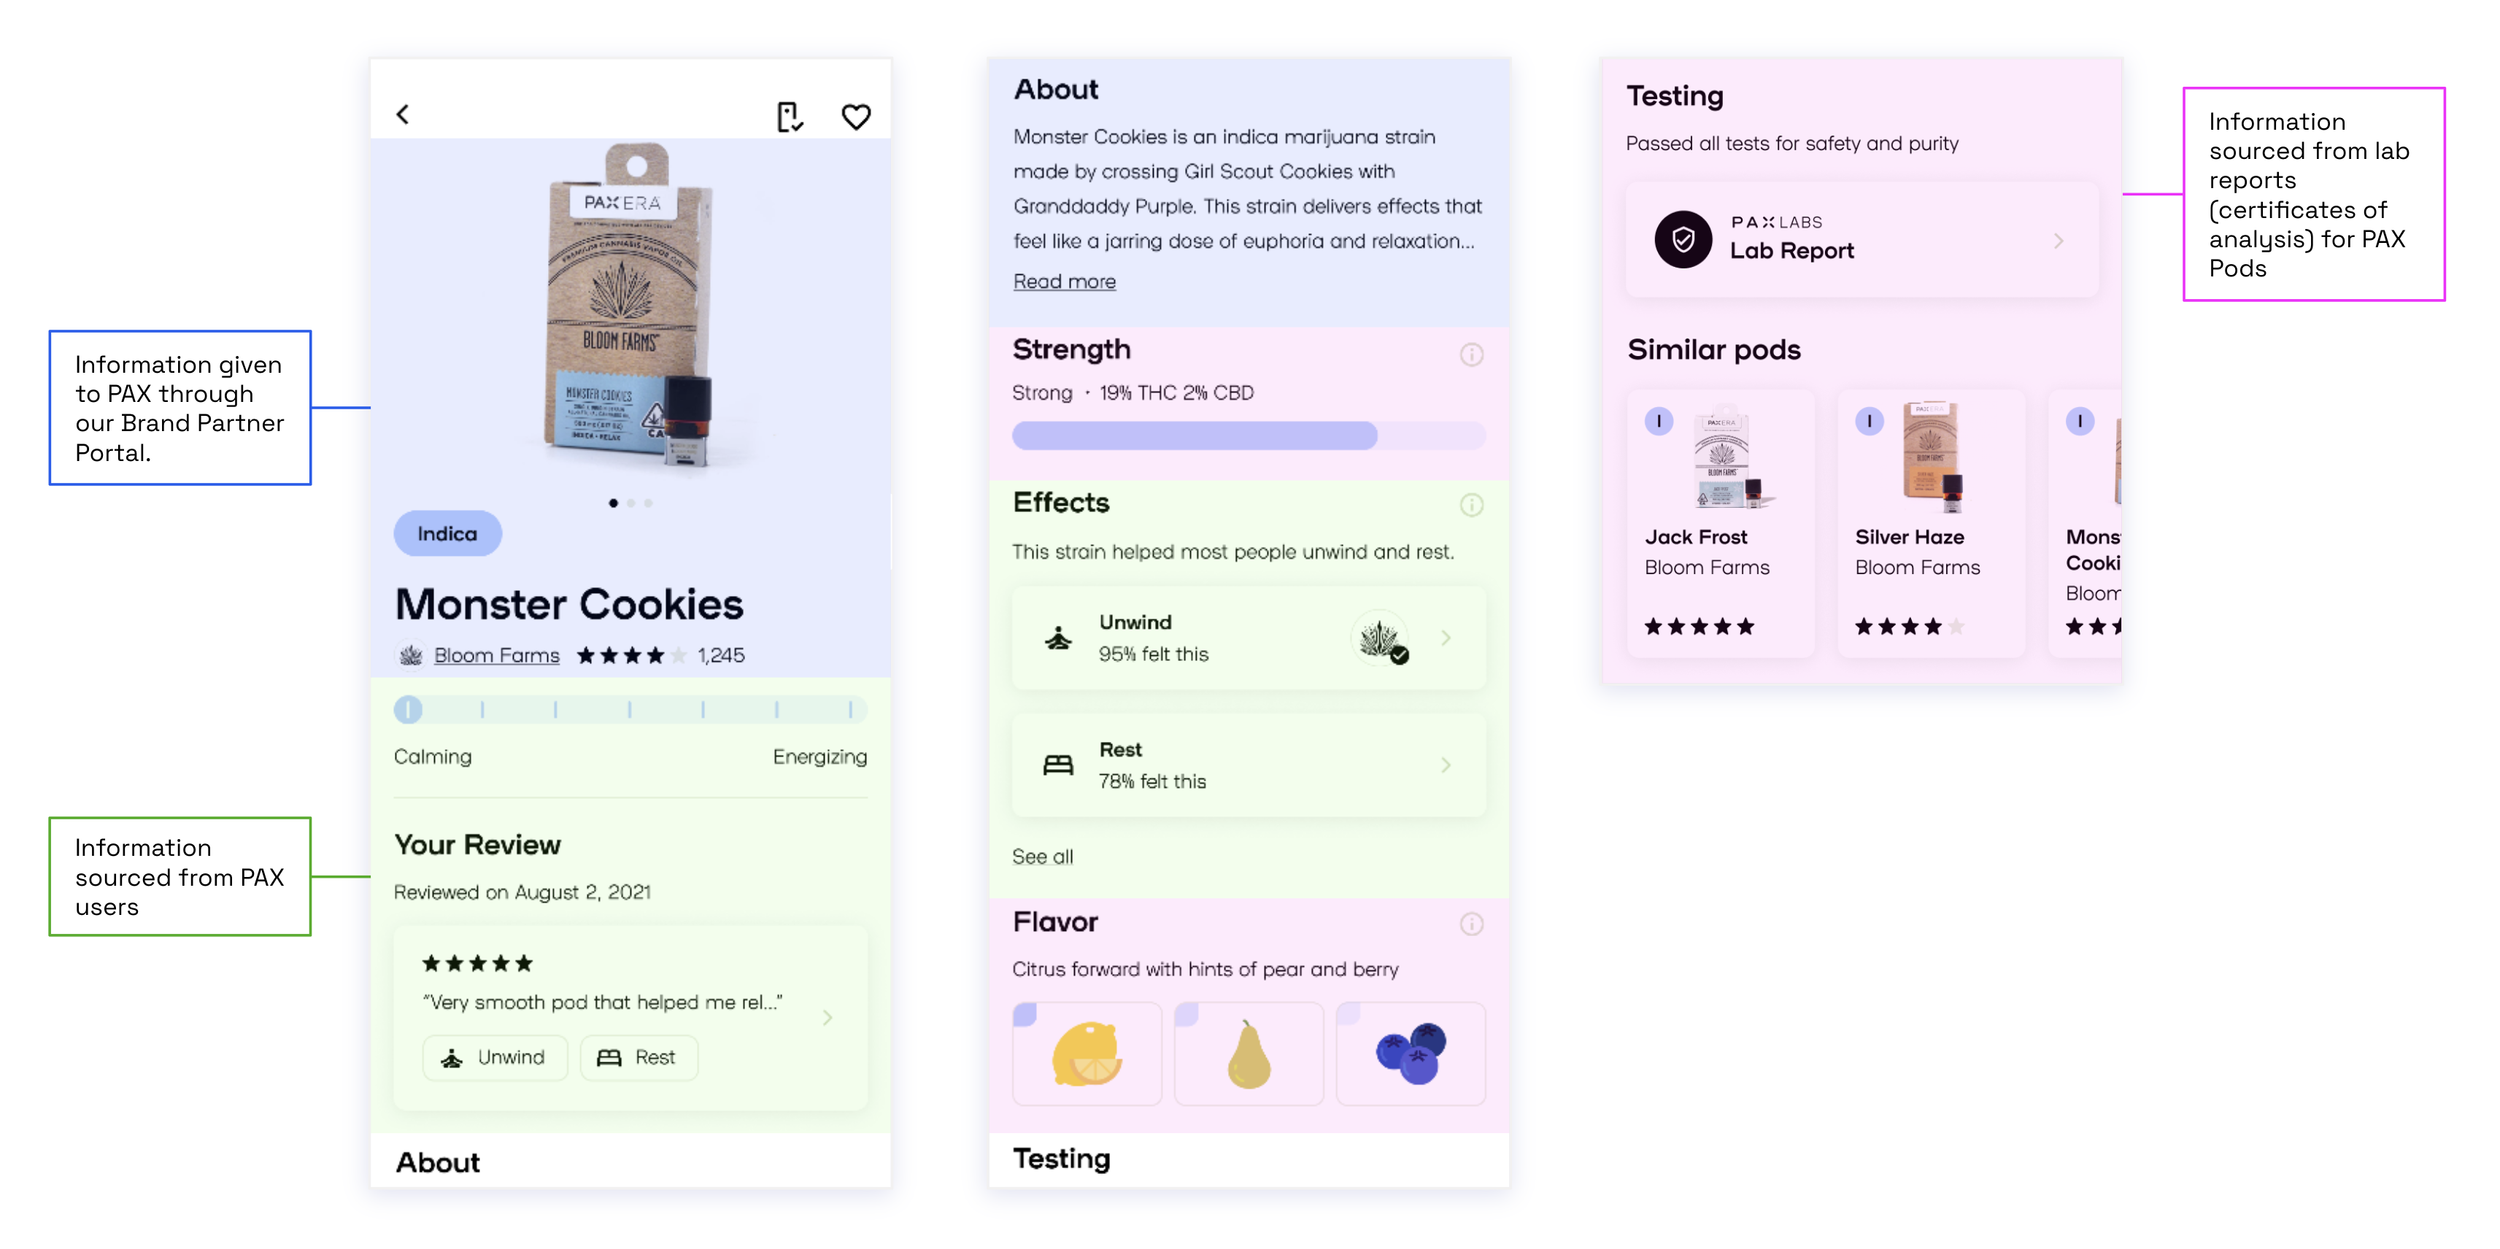
Strain Detail Page
Our most information-dense screen, and most iterated.
Improvements:
Replaced walls of text found on other platforms with structured, scannable modules
Switched to user-verified “top 3 effects” vs vague sliders
Surfaced Certificates of Analysis through expandable panels
Used calm neutrals + soft shadows to reduce visual fatigue
📈 Result: +30% increased time-on-screen
🧪 Design Iteration
🚀 Release & Outcomes
We shipped Explore Pods in two key phases:
MVP with Ratings, Reviews, and Strain Pages
Full release with quiz flow, home/ search experience, and brand partner data
📊 Measurable Results:
42% feature adoption in first 6 weeks
4.2★ Play Store rating, up from 3.9
5 min avg. session duration in Explore Pods
13% increase in pre-purchase intent, tracked via survey + usage correlation
🌱 Strategic Impact
Reinforced PAX’s brand as a trusted guide in a fragmented, stigmatized market
Established design principles that influenced future work across PDPs, onboarding, and CRM
Sparked org-wide initiatives around transparency, credibility, and emotional clarity in UX

✨ Lessons Learned
Personalization isn’t just a UX trick—it’s a trust mechanism
Design systems reduce friction across surfaces and teams
Transparency builds brand loyalty when paired with simplicity
Launching imperfectly (MVP first) gave us sharper data and real momentum
Flow 2: Quiz-Based Personalization

💡 Why it worked:
Created an approachable onboarding entry point
Adjusted tone and logic based on usage level
Provided “Why this pod?” rationale to build trust
Flow 3: Manual Browsing & Filtering

💡 Why it worked:
Filters prioritized effects, THC %, strain type, flavor
Chips stayed sticky to reduce context-switching
Created parity between mobile and desktop interaction
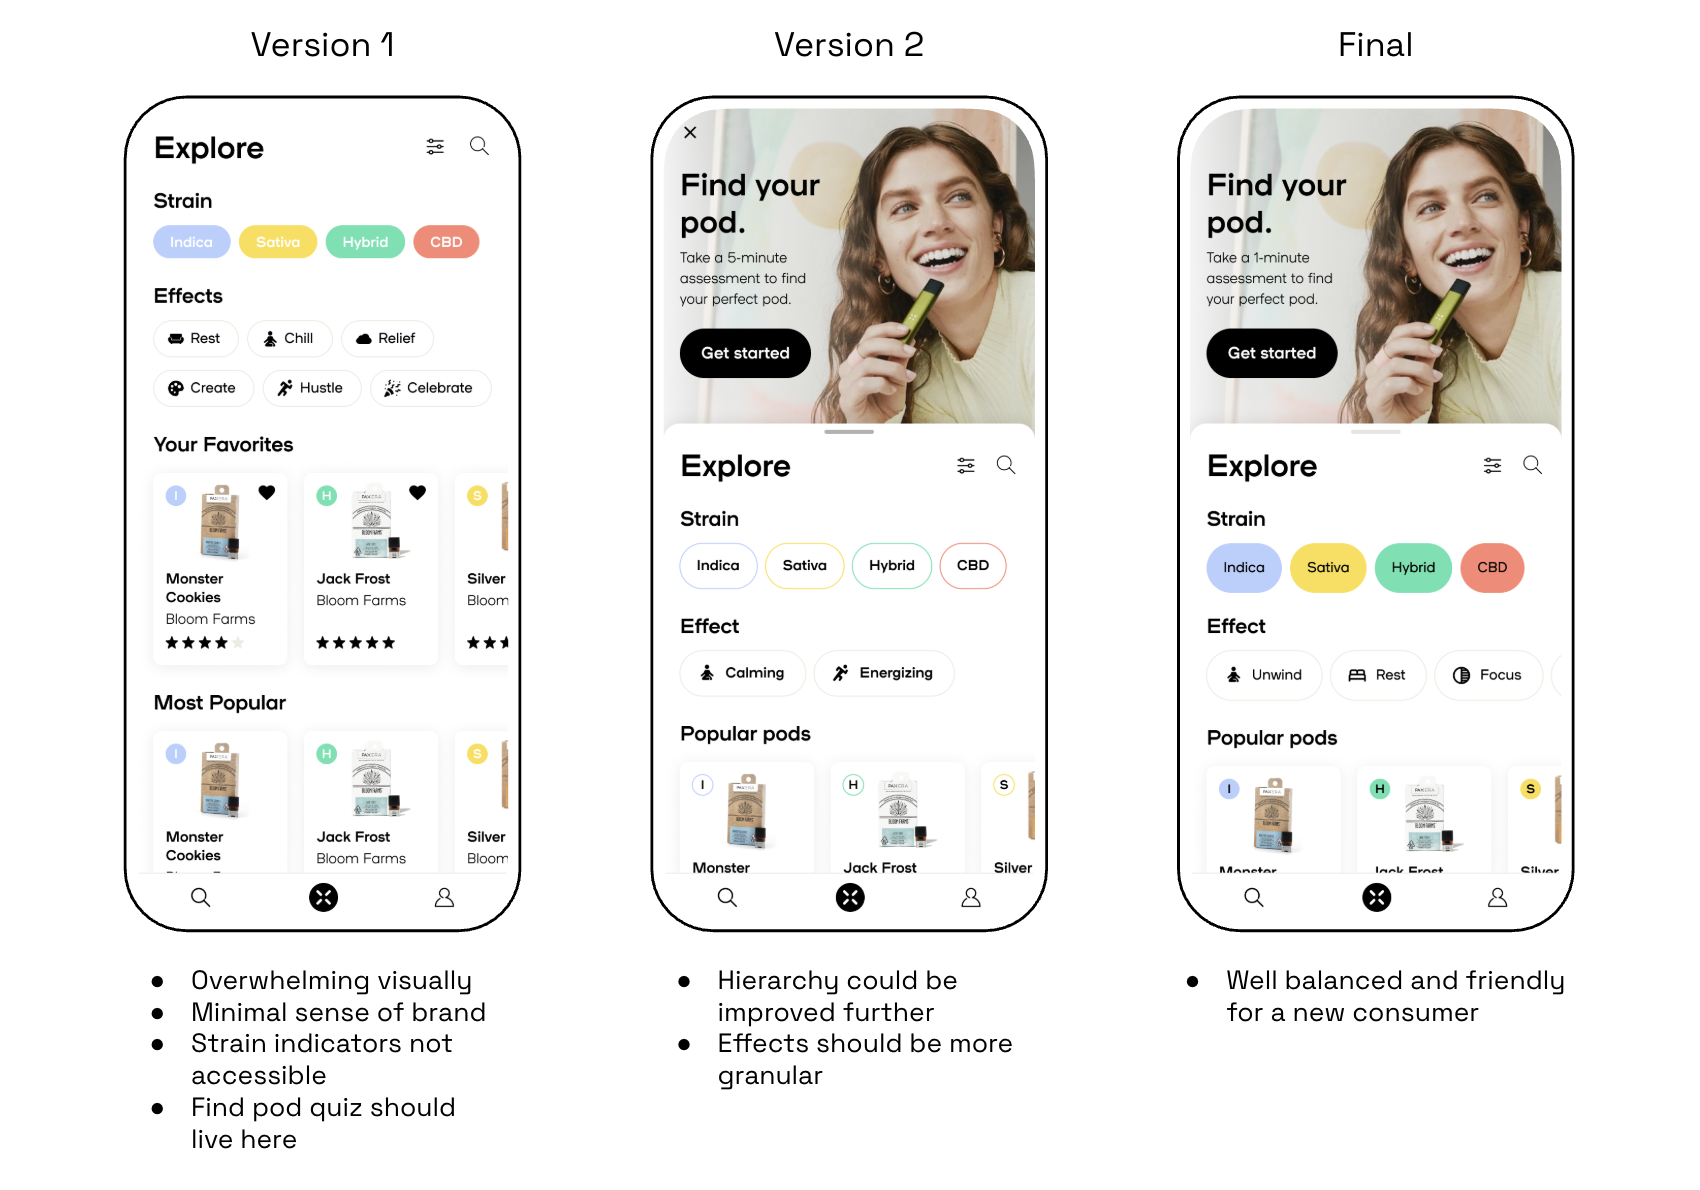
Flow 4: Find Your Pod Quiz

💡 Why it worked:
Used conversational language ("What do you want to feel?")
Alternated input types (chips, sliders) to reduce fatigue
Introduced an explainer for “Why this pod?” to enhance transparency
Prioritized hierarchy and contrast for mobile thumb zones
Strain Effects Iterations
Early versions of the strain effects UI used a slider to place each strain on a calm → energizing spectrum. While visually clean, users found it ambiguous and misleading—most didn’t understand what the slider actually measured, and it falsely implied a level of precision we couldn’t support.
We pivoted to a top-3 effects model, drawn from real user feedback and lab data. Effects were shown as simple, stacked chips (e.g. relaxed, creative, focused), paired with percentage-based indicators like “62% of users felt calm.”
This model:
Improved clarity and mobile scannability
Boosted user trust by grounding effects in verified usage data
Simplifying the visual language around effects made the product feel more honest, approachable, and useful—especially for new users navigating cannabis for the first time.
Component System
I built a set of 80+ responsive components covering:
Ratings modules
Quiz question types
Effect tags and chips
Verified badges and pod cards
Carousels, filters, and micro-interactions
All components were tokenized and added to our shared library, powering future e-comm work and app flows.